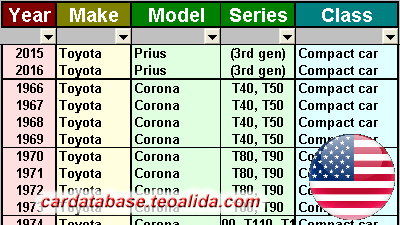
I copied all cars specifications from Edmunds and used AVERAGEIFS formulas to analyze how cars sold in United States evolved over past 35 years.
Charts created first time in 2019, updated August 2024 (72153 model trims in database). The charts does NOT take in consideration number of cars sold, low-production high-powered cars inflate average horsepower figures. You can buy full Excel database to analyze yourself: Year-Make-Model-Trim-Specs.
The average engine size rose from 3.33 L in 1990 to 4.09 L in 2007 then dropped to 3.41 L in 2024 due to introduction of turbochargers that allowed downsizing engines, meantime horsepower rose from 143 HP in 1990 to 325 HP in 2024.
In terms of engine size, American domestic are above European and Asian imports because of trucks with many trims and cab configurations available. In terms of engine power, European cars are above because of numerous sport cars.
Cars also grew in terms of external dimensions, but the increase in weight was most significant because more and more SUV models came on market, which also need more power. American and European manufacturers discontinued many car models in 2020 to focus on SUV, causing a sharp increase in average height and weight and a sharp decrease in average MPG.
Before current upward trend, the 1973 and 1979 oil crisis caused a downward trend from mid-1970s to mid-1980 when most American domestic cars were reduced in dimensions and engine size (and possible horsepower was also reduced at smaller extent). For same reason, imported cars gained marketshare (smaller and higher fuel efficiency). Before 1970s even if the number of distinct imported models was similar with number of distinct domestic models, 90% of cars sold in US were from domestic manufacturers.
Edmunds show car specifications starting from 1990. Where I can find a complete list of older cars sold in USA, including engine size and horsepower, to analyze them too?


